MOUNTAIN VIEW SINGLE-FAMILY HOMES
2026 Half Year Report
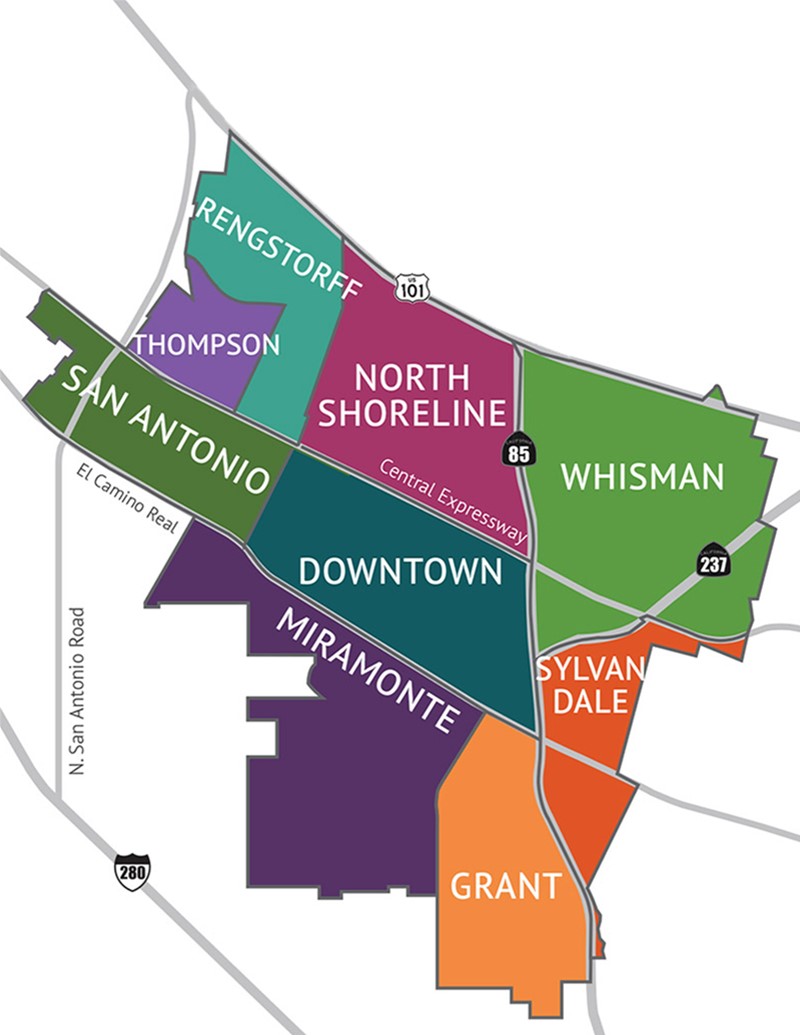
Rollover or click map to see more information for each area.
200 WHISMAN
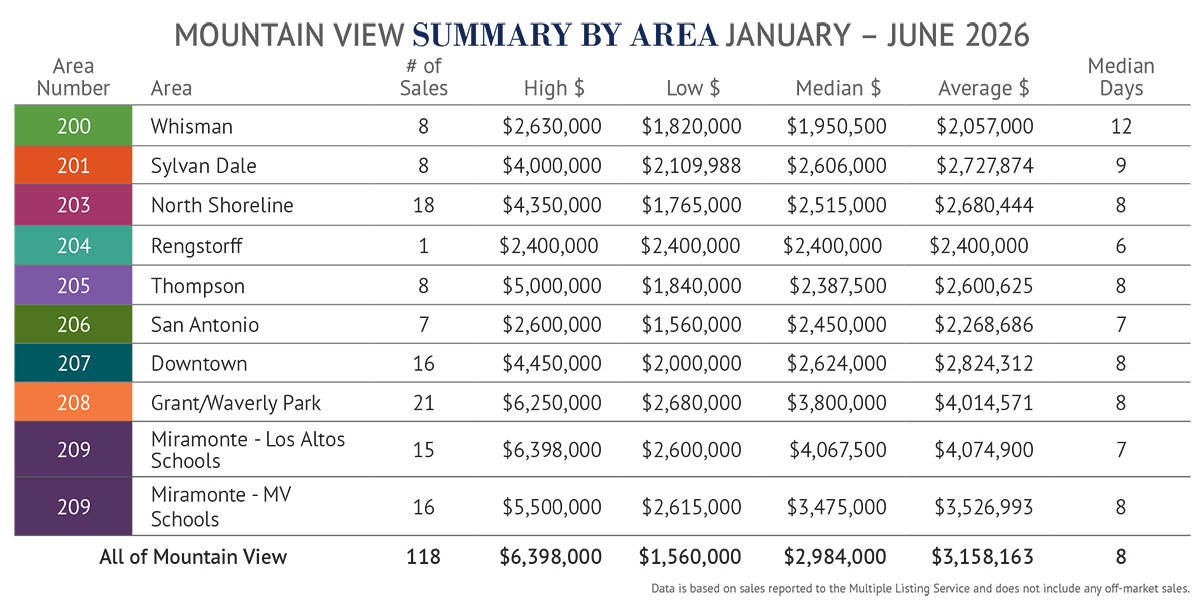
There were just 8 sales in the 1st half, compared to 16 in the 1st half of last year. 6 of the 8 sales were for more than list price and by as much as 14% more. The average and median price were lower than they were last year when they were each over $2.2 million. 4 of the 8 homes sold for more than $2 million.
206 SAN ANTONIO
There were 7 sales in the 1st half compared to 4 in the 1st half of last year. Both the average and median prices were record highs exceeding $2 million for the first time. All but 1 home sold for list price or more and in 11 days or less.
201 SYLVAN DALE
There were 8 sales in the first half compared to just 3 in the 1st half of last year. 5 of the 8 homes sold for more than list price and 6 sold in 9 days or less. Both the average and median prices were record highs.
207 DOWNTOWN
This popular area had fewer sales than normal with 16 sales compared to 21 sales in the same period last year. Only 2 homes sold for less than list price and only 3 took longer than 2 weeks to sell. The average and median price each reached a significant new record high.
203 NORTH SHORELINE
There were 18 sales in the 1st half compared to 14 in the same period last year, and it was the second highest volume of all the areas. Both the average and median price reached record high prices. Demand was particularly strong with all but 4 homes selling for more than list price and by as much as 48% more.
208 GRANT/WAVERLY PARK
This area had more sales than any other area. There were 21 sales compared to 16 sales in the same period last year. 12 of the homes sold for more than list price. Record-high prices including the average price exceeding $4 million for the first time and a record high individual price exceeding $6 million for the first time. Only 5 homes sold for less than list price.
204 RENGSTORFF
There was just 1 sale in this area that sold for 23% over list price at $2,400,000. This represents a 12% increase in average price compared to last year.
209 MIRAMONTE–LOS ALTOS SCHOOLS
This high-demand area had 15 sales compared to 17 in the same period last year. Record-high average and median prices each exceeded $4 million for the first time. A record-high individual sale exceeded $6 million for the first time. Only 2 homes sold for less than list price; 11 sold for more than list price.
205 THOMPSON
8 homes sold in this area compared to 11 in the same period last year. All of the homes sold for more than list price. The average price was significantly higher than last year due to a record-high sale of $5 million, which sold over list price, and only 1 sale for less than $2 million. 6 of the 8 sales occurred in 9 days or less.
209 MIRAMONTE–MTN VIEW SCHOOLS
This area had 16 sales in the 1st half of the year compared to 18 sales in the same period last year. Both the average and median price were significant new record highs. Only 2 homes sold for less than list price; 13 of the 16 sales were for more than list price. Only 4 homes took more than 2 weeks to sell.
RECAP OF 1ST HALF 2026
- Record-high prices
- Average price up 9% to more than $3 million
- Median price up 10% to almost $3 million
- 75% sold over list price
- 77% sold in 2 weeks or less
- 2 record-high sales of more than $6 million
NUMBER OF SALES
There were 118 single-family homes sold through the Multiple Listing Service, 45 in the 1st quarter and 73 in the 2nd quarter. This compares to 121 in the 1st half of 2025 and 126 sales in the 1st half of 2024. There were still few homes for sale and the decline in sales was not because of low demand.
In addition to the 118 single-family home sales, there were also 145 condo/townhome sales compared to 128 in the same period last year. If you would like further details on condo/townhome sales this year, please see below.
PRICES
Prices reached record highs. The average price increased 9% compared to last year and the median price increased 10%. A significant 71% of all sales were in the $2 million to $3 million price range. Only 9 sales, or 8%, were for less than $2 million and there were no sales for less than $1.5 million. There were 25 sales, or 21%, for $4 million or more, including 2 record-high sales exceeding $6 million for the first time ever in Mountain View. 75% of the homes sold for more than list price – a clear indication of demand.
The price per square foot in the 1st half was $1,730 – a new record high and 3% higher than last year.
LENGTH OF TIME TO SELL
Strong demand was also evidenced by how quickly homes sold. 77% sold in 2 weeks or less and 47% sold in one week or less. Only 10% took longer than 30 days to sell.
OUTLOOK
As outlined in our Market Outlook at the beginning of the year and again in our 1st Quarter Report (both available on the Market Data tab at troyercabot.com), continued buyer demand was anticipated throughout 2026, and that is exactly what has unfolded. The limited supply of available homes has remained the defining characteristic of the market, and there is little indication that inventory will increase significantly during the second half of the year.
With the continued strength of the stock market and the anticipated IPOs of several AI-related companies, buyer confidence is expected to remain strong. Financial market fluctuations and geopolitical events could still create periods of uncertainty, but the underlying fundamentals that have long supported the Mountain View market remain firmly in place. Exceptional schools, a vibrant downtown, proximity to many of the world’s leading technology companies, and a limited supply of homes continue to drive demand and support home values.
With just 16 homes currently available for sale, plus another 6 being marketed privately, conditions continue to favor sellers. If you are considering a move, this is an excellent time to explore your available opportunities. Troyer & Cabot Group has a long history of efficiently preparing homes for market, positioning them to achieve exceptional results, and guiding clients through every step of the process. Please contact us to schedule a confidential consultation, without obligation, to learn what today’s market could mean for you.
Mountain View Condos/Townhomes
2026 Half Year Report
Rollover or click map to see more information for each area.
200 WHISMAN
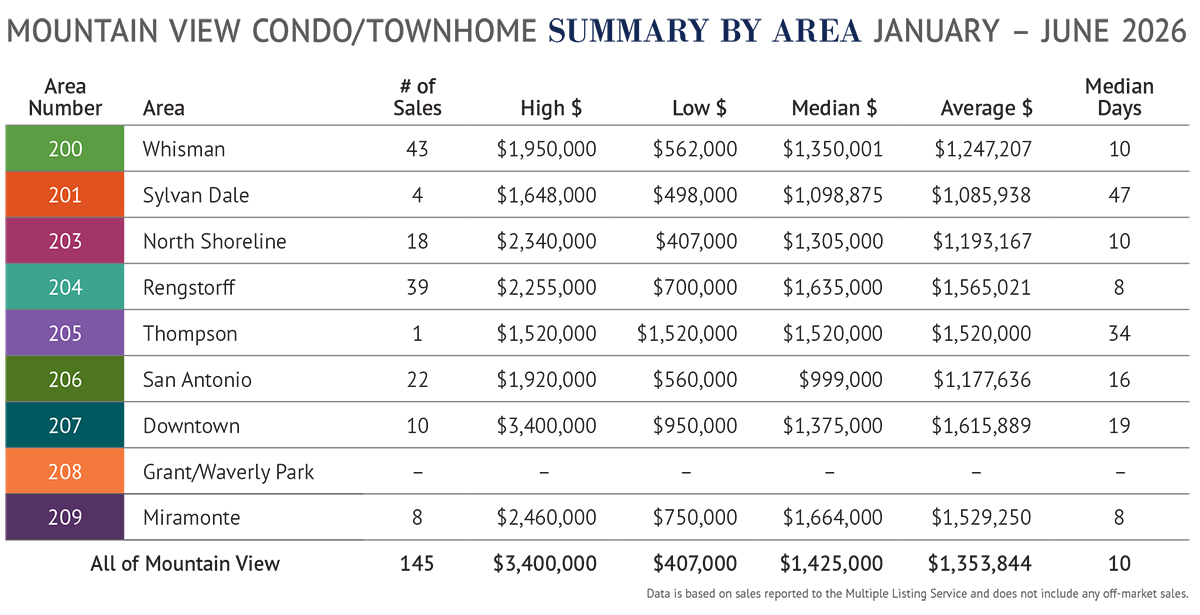
This popular area had the highest number of sales in the 1st half at 43, compared to 31 in the 1st half of last year. 31 of the homes, or 72%, sold for more than list price. 15 homes sold for $1.5 million or more and 13 homes sold for less than $1 million. The average price dropped 8% since last year and the median price dropped 9%.
206 SAN ANTONIO
There were 22 homes sold in the 1st half compared to 32 sales in the 1st half of last year. 59% of the homes sold for more than list price and another 14% sold for list price. The average and median price were steady with last year. 11 homes sold in less than 2 weeks and 7 homes took longer than 30 days to sell.
201 SYLVAN DALE
There were 4 sales compared to 6 sales in the 1st half last year. Only 1 sale, the most expensive, was for more than list price. Homes took longer to sell here with the highest median days on market of any area, except for the one listed by Troyer Cabot Group, which sold in just 4 days. Both the average and median price were significantly higher than last year and each over $1 million for the first time.
207 DOWNTOWN
There were 10 sales in this area compared to 9 in the same period last year. 6 of the homes sold over list price and 4 homes sold in less than 1 week. Both the median and average prices were lower than last year.
203 NORTH SHORELINE
There were 18 sales in this area compared to 15 sales in the same period last year. 9 sales were for more than list price. Both the median and average price were lower than they were last year. 10 homes sold in 11 days or less but 8 homes took longer than 2 months to sell.
208 GRANT/WAVERLY PARK
Few condo/townhome sales occur in this area. There were no sales in this area in the 1st half of 2026. There was 1 sale last year at $1,840,000. Prior to that there had not been any sales since 2022.
204 RENGSTORFF
This in-demand area had 39 sales, the second highest count, compared to 28 sales in the 1st half of last year. 29 of the homes, or 74%, sold for more than list price including the most expensive sale, $2,255,000, that sold for 13% over list price. Half of the homes sold in just 8 days or less.
209 MIRAMONTE
There were 8 sales in the 1st half compared to 5 sales in the 1st half of last year. All homes sold for list price or more. The average and median price were each higher than last year. The most expensive home sold was 30% over list price and it sold in 7 days. At $2,460,000, it was the third highest price ever recorded for a condo/townhome in Mountain View.
205 THOMPSON
There are often no sales in this area so it is not uncommon that in the 1st half of this year there was just 1 sale, which sold over list price. The average price was lower than last year’s average, which was $1.9 million.
RECAP OF 1ST Half 2026
- Record high average and median price
- Record-high individual sale of $3.4 million
- 66% sold over list price
- 60% sold in 2 weeks or less
- 8 sales for $2 million or more
NUMBER OF SALES
There were 145 condos/townhomes sold through the Multiple Listing Service, 61 in the 1st quarter and 84 in the 2nd quarter. This compares to 128 sales in the 1st half of 2025 and 140 sales in the 1st half of 2024. Inventory has increased but there are still few homes for sale and lower number of sales is not because of low demand.
In addition to the 145 condo/townhome sales, there were 118 single-family home sales. If you would like further details on single-family home sales this year please scroll to the top of this page.
PRICES
The average price reached a record high at $1,353,844, representing a 3% increase since last year. The median price was also a record high at $1,425,000, representing a 9% increase.
66% of the homes sold for more than list price, compared to 63% in the same period last year. This includes 6 homes that sold for more than 20% over list price.
8 homes sold for $2 million or more and 41 homes sold for less than $1 million.
The average price per square foot in the 1st half was $963, which was just slightly lower than the $965 per square foot in 2025.
LENGTH OF TIME TO SELL
Strong demand was also evidenced by how quickly homes sold. 60% sold in 2 weeks or less and 32% sold in one week or less. 27% took longer than 30 days to sell.
OUTLOOK
As outlined in our Market Outlook at the beginning of the year and again in our 1st Quarter Report (both available on the Market Data tab at troyercabot.com), continued buyer demand was anticipated throughout 2026, and that is exactly what has unfolded. Inventory is still limited particularly with the number of active listings declining in May and June. There is little indication that inventory will increase significantly during the second half of the year.
With the continued strength of the stock market and the anticipated IPOs of several AI-related companies, buyer confidence is expected to remain strong. Financial market fluctuations and geopolitical events could still create periods of uncertainty, but the underlying fundamentals that have long supported the Mountain View market remain firmly in place. Exceptional schools, a vibrant downtown, proximity to many of the world’s leading technology companies, and the affordability of condos/townhomes continue to drive demand and support home values.
There are 60 condos/townhomes currently available for sale, plus another 9 being marketed privately. If you are considering a move, this is an excellent time to explore your available opportunities. Troyer & Cabot Group has a long history of efficiently preparing homes for market, positioning them to achieve exceptional results, and guiding clients through every step of the process. Please contact us to schedule a confidential consultation, without obligation, to learn what today’s market could mean for you.