

LOS ALTOS SINGLE-FAMILY HOMES
2026 3rd Quarter Real Estate Report
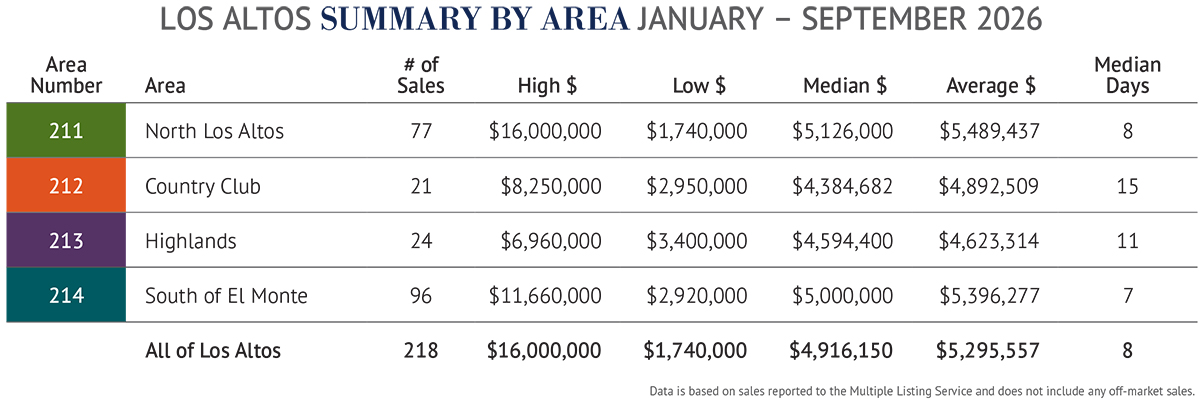
Rollover or click map to see more information for each area.
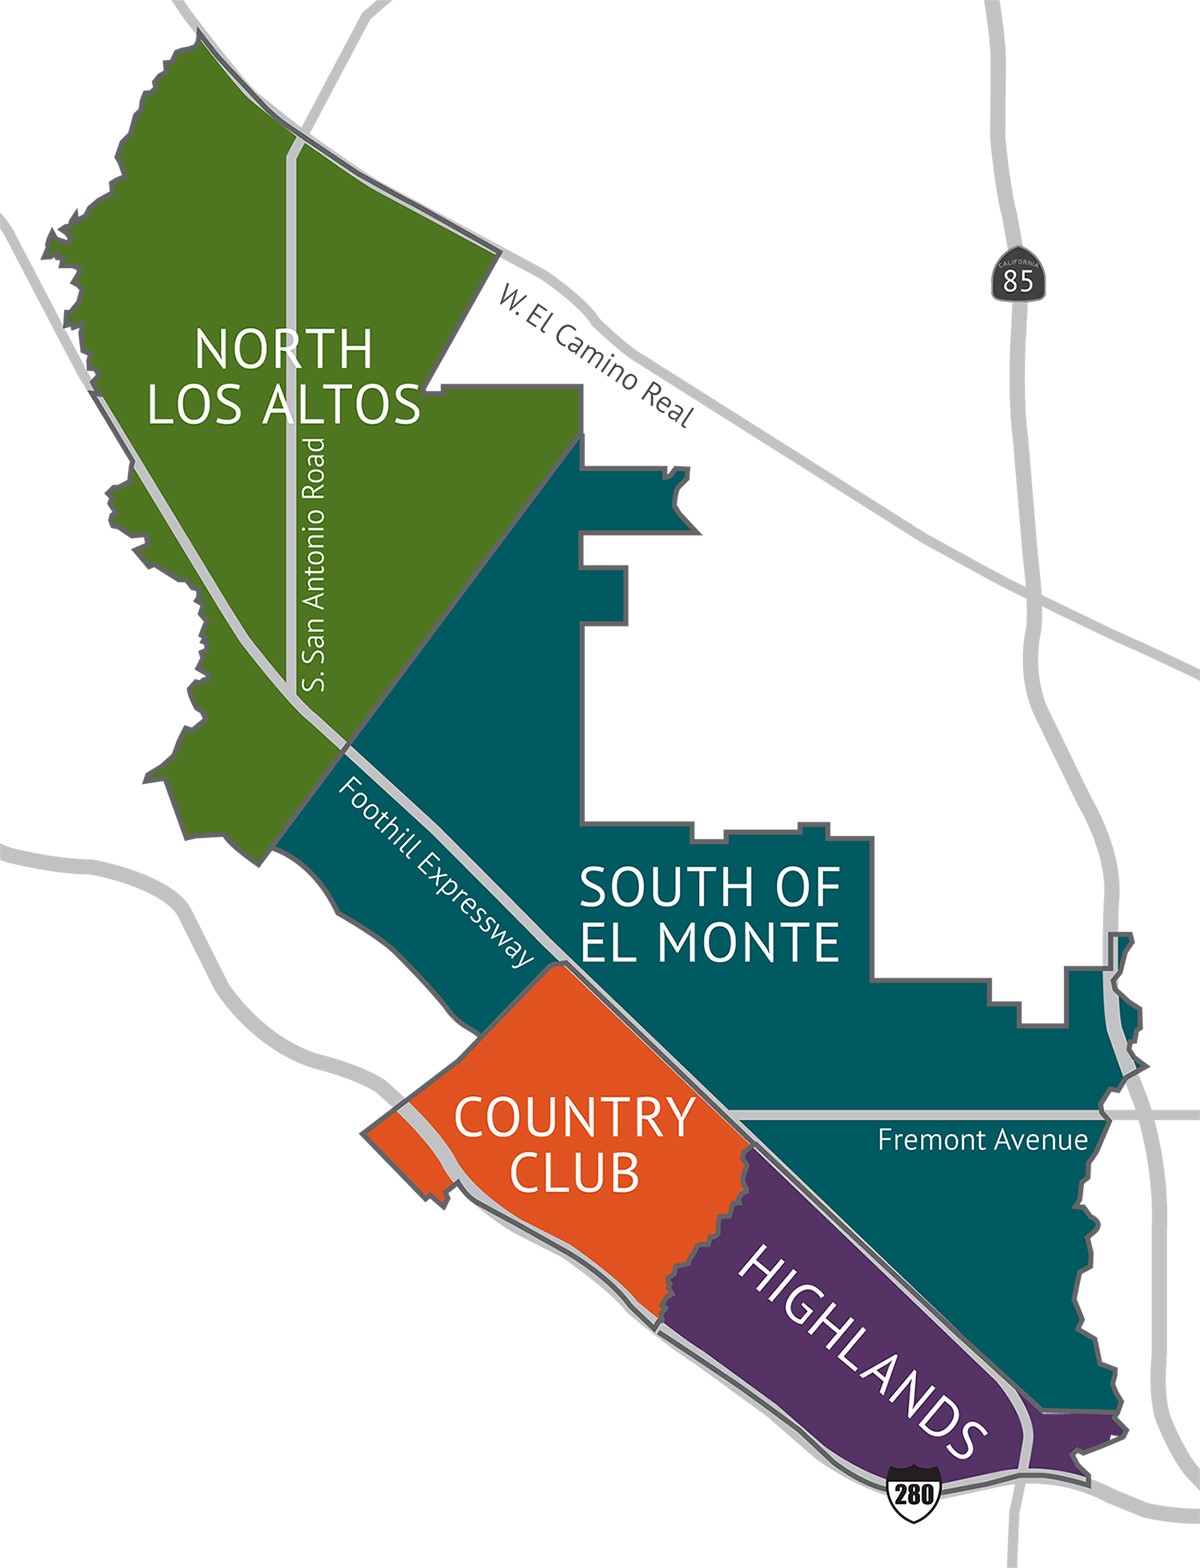
211 North Los Altos
- Average price $5,758,058
- Record-high Los Altos sale of $16 million
- 65% sold for more than list price
The average price in the 3rd quarter was $5,758,058, up from $5,234,879 in the 2nd quarter, and $5,739,400 in the 1st quarter. 13 homes, or 57%, sold for more than $5 million and only 2 homes sold for less than $3.2 million. The average price year-to-date in North Los Altos, of $5,489,437, was 3% higher than it was in all of 2025. The record-breaking sale of $16 million was in this area.
There were 23 sales in the 3rd quarter, compared to 39 sales in the 2nd quarter, and 15 sales in the 1st quarter. 65% of the homes sold for more than list price. Only 4 homes took longer than 3 weeks to sell.
The average price per square foot in North Los Altos in the 3rd quarter was $2,287. This was 7% higher than it was in all of 2025.
213 HIGHLANDS
- Average price in Q3 of $4,621,400
- 4 of the 7 homes sold over list price in Q3
- Record-high average price YTD up 11% since 2025
Sales were strong in the 3rd quarter with 7 sales between $3,550,000 and $6,700,000. There were 13 sales in the 2nd quarter and 4 sales in the 1st quarter. Year-to-date through the 3rd quarter, the average price of $4,623,314 was up 11% compared to all of 2025.
4 of the 7 homes sold in the 3rd quarter sold for more than list price and 1 sold at list price. On average, homes sold for 107% of list price.
The price per square foot in the Highlands in the 3rd quarter was $1,837, which was 4% higher than all
of 2025.
212 COUNTRY CLUB
- Average price in Q3 of $5,414,750
- 8 sales; 3 over list price
- Average price YTD down slightly since 2025
There were 8 sales in the Country Club in the 3rd quarter, compared to only 3 in the same period last year. Prices ranged from $3,125,000 to $8,200,000. There were 7 sales in the 2nd quarter and 6 sales in the 1st quarter. The 3rd quarter average price was $5,414,750 and the median price was $3,990,000, almost $1 million higher than the 3rd quarter last year.
3 homes listed under $4 million sold for more than list price. On average, homes sold for 102% of list price.
The average price per square foot in the Country Club in the 3rd quarter was $1,713. This was 3% lower than it was in all of 2025.
214 SOUTH OF EL MONTE
- Average price in Q3 was $5,707,803
- 8 sales between $7 million and $11.66 million
- 71% sold over list price in Q3
The average price in the 3rd quarter was $5,707,803, compared to $5,403,347 in the 2nd quarter and $4,979,108 in the 1st quarter. Year-to-date, the average price of $5,396,277 was 6% higher than it was in all of 2025.
There were 34 sales in the 3rd quarter; 8 sales were for more than $7 million and there was just 1 sale for less than $3.6 million. Of the 34 sales, 71% sold for more than list price. On average, homes sold for 108% of list price.
Average price per square foot in the 3rd quarter was $2,164, which was 11% higher than all of last year.
RECAP OF 3rd Quarter 2026
- Average Q3 price of $5,585,673; up 15% compared to Q3 last year
- 64% sold over list price in Q3 compared to 54% in Q3 last year
- 69% sold in less than 2 weeks in Q3
- 15 sales for more than $7 million in Q3 compared to 7 in Q3 last year
- YTD average price up 3% compared to all of last year
NUMBER OF SALES
There were 51 sales in the 1st quarter, 95 sales in the 2nd quarter, and 72 sales in the 3rd quarter. This total of 218 sales through the 3rd quarter compares to 211 sales in the same period last year – a 3% increase.
In addition to the 72 single-family home sales in the 3rd quarter, there were 14 condo/townhome sales. If you would like further details on condo/townhome sales this year, which are not included in this report, we would be happy to provide them to you.
PRICES
A record-breaking price for an individual home occurred in the 3rd quarter at $16 million. The previous high was $13.25 million.
The average price for the 72 homes sold in the 3rd quarter was $5,585,673. 15 homes sold for more than $7 million and 34 homes sold for more than $5 million. Only 3 homes sold for less than $3.1 million.
The average price in the 3rd quarter was up 15% compared to the same quarter last year. Year-to-date through the 3rd quarter, the average price of $5,295,557 was up 3% compared to all of last year.
The median price in the 3rd quarter was $4,910,150, representing a 14% increase compared to the same quarter last year. Year-to-date through the 3rd quarter, the median price of $4,916,150 was up 1% compared to all of last year.
The price per square foot through the 3rd quarter was $2,097 – a 6% increase compared to all of 2025 and a new record high.
There were 46 homes, or 64%, that sold for more than list price in the 3rd quarter. On average, homes in the 3rd quarter sold for 107% of list price. It is important to also note that 10 homes sold for more than $1 million over list price and up to as much as $1.52 million over list.
LENGTH OF TIME TO SELL
Homes sold very quickly in the 3rd quarter with half selling in just 8 days or less and 69% selling in less than 2 weeks. On average, homes in the 3rd quarter sold in 23 days.
OUTLOOK
As outlined in our Market Outlook at the beginning of the year and again in our 1st Half Report (both available on the Market Data tab at troyercabot.com), continued buyer demand was anticipated throughout 2026, and that is exactly what has unfolded. The limited supply of available homes has remained the defining characteristic of the market, and there is little indication that inventory will increase significantly before the end of the year.
Steady demand, limited inventory, and strong buyer confidence continue to define the local market. A clear indication is 10 homes selling for more than $1 million over list price. With the continued strength of the stock market and the anticipated IPOs of several AI-related companies, buyer confidence is expected to remain strong.
With just 20 homes currently available for sale, plus another 3 being marketed privately, conditions continue to favor sellers. If you are considering a move, this is an excellent time to explore your available opportunities. Troyer & Cabot Group has a long history of efficiently preparing homes for market, positioning them to achieve exceptional results, and guiding clients through every step of the process. Please contact us to schedule a confidential consultation, without obligation, to learn what today’s market could mean for you.